3 artifacts
Tap to collapse details
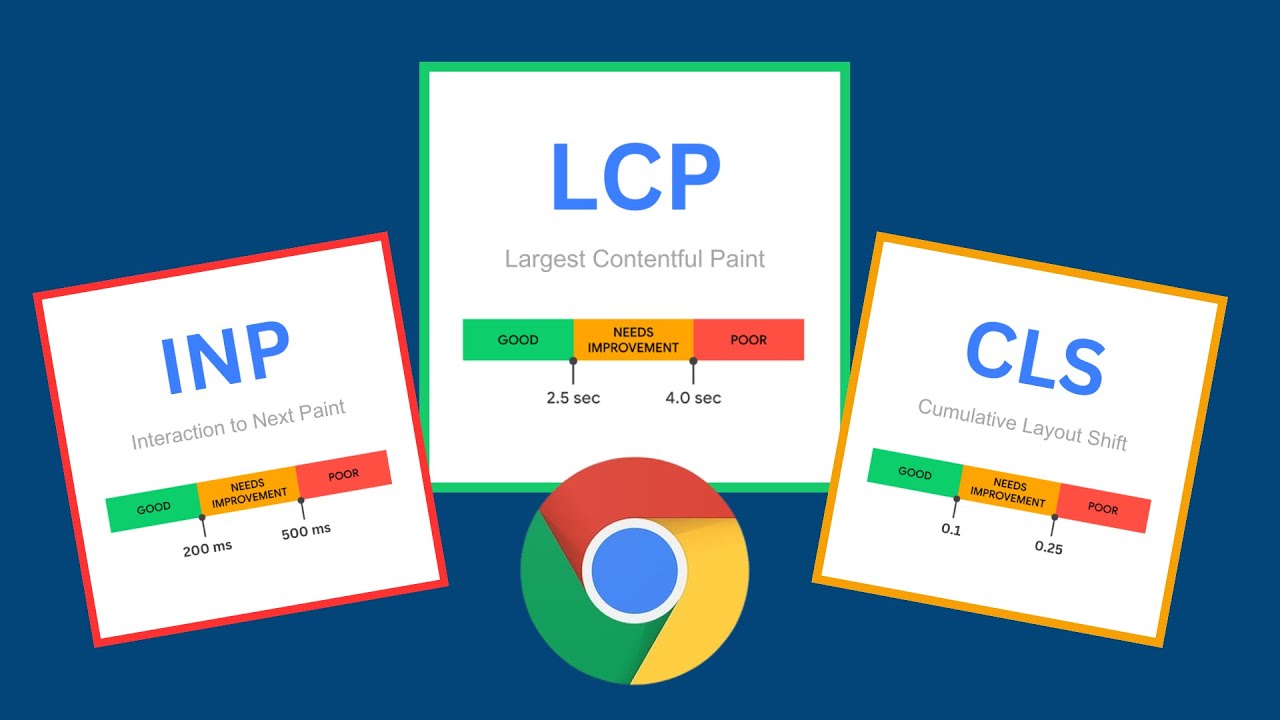
Core Web Vitals consist of three metrics:
Read official documentation:
Take notes on definitions, thresholds, and differences between lab (simulated) and field (real-user) data.
❌ Confusing lab data with field data
→Remember lab is for debugging, field for real-user experience
❌ Ignoring mobile vs desktop differences
→Always check both device types in reports
Tap to expand details
Spin up a personalized “learn Core Web Vitals” plan you can save, check off, and return to anytime — unlimited on the free trial.
web.dev
Udemy
Frontend Masters
by Unknown
Official guides on metrics, measurement, and optimization
Definitions, thresholds, and assessment details
Free tool for lab and field Core Web Vitals analysis
JavaScript library to measure Core Web Vitals in production
Built-in auditor for lab-based Core Web Vitals
Combines Lighthouse and CrUX for field/lab data